Sentiment Analysis of COVID-19 Tweets
Summary
This was a group project for CS 490A Natural Language Processing during the Fall of 2020. I worked in a group with two other students. Britney Muth and Holly Wagner.
We used GitHub for version control and communicated with discord. For the code we used Python and the scikit-learn machine learning library.
The goal of this project was to compare different classification methods used for Sentiment Analysis.
For this project we wanted explore 3 conventional machine learning approaches as well as another human built approach to Sentiment Analysis.
Sentiment Analysis is a natural language processing technique in which a computer determines if a piece of data is Positive, Negative, or Neutral.
In our case, the data is tweets from the first 2 months of the COVID-19 Pandemic. The computer needs to decide if each tweet has a positive, negative, or neutral sentiment.
Twitter is a great source for gathering overall public opinion, including public opinion of the pandemic.
The ability to gauge the stance of the public on certain issues relating to the pandemic has several potential applications.
For instance, resource strain, political unrest and noncompliance with social distancing regulations like curfews are all tied to how people respond in times of crisis.
Tuning an accurate model to assess the sentiment of individuals on such topics would be a useful first step in achieving this task.
Dataset
The dataset that we are using was obtained from Kaggle. This dataset contains ~45k entries that are already labelled.
It is also already partitioned into training and test data (~4k entries).
The dataset contains important information such as location, date tweeted, the label (sentiment of tweet) and of course the raw text of each tweet.
The dataset however does not come cleaned and so we implemented a clean_data function and a cleaned_csv function for this purpose located in ConvertData.py.
The challenge with cleaning the data was reading non ‘utf-8’ characters from the csv. Because all the data comes from twitter, there are a lot of emojis and other characters that are hard to deal with.
For our data we only wanted to look at the words, so we had a string of “allowed characters” that we care about.
This means we parsed every tweet and deleted every character that was not in [a-z][0-9] and [-@$#%]. This is so we include money amounts, @ing users, hashtags, and percents.
This way we can read the original csv files using latin-1 and then we can exclude any characters that will hinder the tokenization. We then saved the changes into a new csv file.
Classifiers
We decided to use a TF-IDF Vectorizer (Term Frequency-Inverse Document Frequency) to select our feature vectors.
The purpose behind this vectorizer is to lower the weights of terms that occur in many documents (tweets).
For example, the word "the" will be very frequent in many tweets, but the word carries no significant sentiment.
The feature vectors are then used to trained on 4 different classifiers: Naive Bayes, Logistic Regression, and Random Forests. A 5th classifier called VADER was also used.
VADER is a human made classififer designed for Sentiment Analysis. It uses a dictionary of terms that have already been pre-weighted with human input.
Unlike the other classifiers that compute the P(Sentiment | word) for every word in a tweet, VADER looks up the weight of every term in the tweet and then sums them together.
The final sentiment is determined by the sum of the weights: if the sum > 0 it is positive, if the sum < 0 it is negative, if the sum is between [-0.05, 0.05] it is neutral.
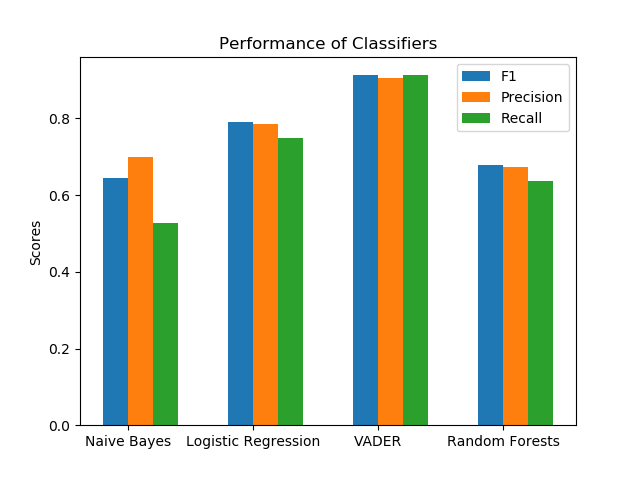
Results
| Accuracy(F1 score) | Precison | Recall |
| Naive Bayes | 0.6451 | 0.6997 | 0.5278 |
| Logistic Regression | 0.7915 | 0.7842 | 0.7498 |
| VADER | 0.9134 | 0.9048 | 0.9123 |
| Random Forests | 0.6793 | 0.6737 | 0.6344 |
| Top TF-IDF Scores |
| Rank | Positive | Negative | Neutral |
| 1 | coronavirus | coronavirus | coronavirus |
| 2 | 19 | 19 | 19 |
| 3 | covid | covid | covid |
| 4 | covid19 | food | covid19 |
| 5 | store | prices | store |
| 6 | grocery | covid19 | supermarket |
| 7 | supermarket | supermarket | grocery |
| 8 | food | people | prices |
| 9 | prices | store | panic |
| 10 | amp | panic | shopping |
Conclusion
The results of the project show that VADER performed the best. This is expected since VADER is a dictionary-based classifier that was made for Sentiment Analysis.
Additionally, Logistic Regression performed higher than expected. We can see some insight into what words had the most value to the American people by looking at the top 10 highest scoring terms.
This table shows the highest valued words according to their TF-IDF score. To our surprise, words like food, supermarket, and prices were highly valued in determining sentiment.
This shows that one of the most important concerns for the people, was where is there food coming from, and how much does it cost?